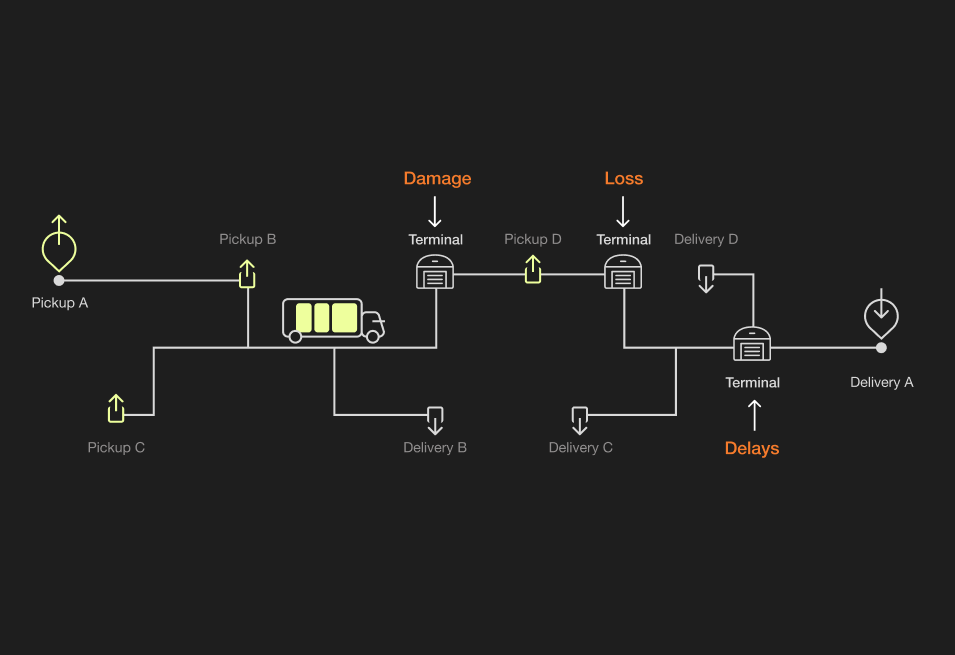
Annual Study Reveals Wasted Capacity & Additional Fees Aren’t Market-Dependent

Despite favorable freight market conditions for shippers, nearly half of the truckloads shipped in 2022 were partially empty — wasting capacity and costing money, time, and fuel. In partnership with Drive Research, Flock Freight’s annual study* explores how freight market conditions evolved year-over-year, what supply chain inefficiencies arose, and why shippers continue to be impacted.
What inflationary & deflationary conditions mean for industry trends
In 2021’s inflationary market, there was a surge in consumer demand — resulting in major supply chain disruptions and a shortage of drivers to keep up. Flock’s original study with Drive Research revealed these disruptions weren’t from lack of available space to carry these goods, but rather, inefficiencies in the supply chain: half the trucks clogging dockyards and highways were moving at less-than-maximized capacity. In 2022, consumer buying habits slowed given the rising inflation rate and global trade seemed to come to a halt — thus resulting in a deflationary market. Shipper’s began to see an excess in inventory leftover from last year’s demands.Although market conditions fluctuate year-over-year (YoY), this year’s study revealed shippers are still experiencing the same inefficiencies in a deflationary market as they were in an inflationary one. In fact, 10x the number of shippers reported experiencing OTIF fines in 2022 than in 2021, and only 55% of shippers filled their trucks to capacity last year.
Shippers paid $1,988 on average for each damaged & late LTL shipment in 2022
The average cost that shippers paid for each damaged and late less than truckload (LTL) shipment was determined by adding the average uncovered damage cost per shipment of $1,511 to the average OTIF fee per shipment of $477, resulting in a total of $1,988.

In general, higher commodity values typically result in increased damage costs. For example, building materials, technology/electronics, and industrial machinery/equipment industries reported paying over $5,000 on average per shipment for damage claims.Other key findings on LTL inefficiencies in 2022 include:
- OTIF fees are costing shippers $253,198 in average, with $83,064 from LTL shipments
- 100% of LTL shippers were charged accessorial fees on shipments
- 88% of LTL shippers who experienced late freight indicated it was 1-2 days late.
- 86% of LTL shippers experienced damaged freight, with LTL carriers covering only 66% of those damage claims
Nearly half of truckloads shipped in 2022 moved partially empty.
Almost 3x the amount of shippers were booking truckload (TL) in 2022 than 2021 because they weren't sure another mode would deliver on time; however, 21% of U.S. truckload freight capacity is going to waste within partially empty trucks.In fact, 45% of shippers in 2022 reported shipping partially empty truckloads with an average of 25 linear ft of unused deck space.

Flock’s reliable shared truckload solution withstands freight market changes
As shippers face growing pressure to deliver goods on time and on budget, the survey’s results also reveal an opportunity for shippers to only pay for the space they need — while avoiding the usual costs of inefficient shipping modes. "Limited choices among outdated shipping modes forces customers to pay for inefficient options that no longer work. We believe shippers should have the flexibility to move their goods on time and on budget,” says Oren Zaslansky, founder and CEO of Flock Freight.Using patented technology, Flock Freight is creating lasting change within the freight industry. Flock’s aim is to reduce the issues that plague other shipping modes permanently by shifting the freight market to a shared truckload (STL) model where everyone can ship freight on demand via truckload service, regardless of shipment size. By combining freight from multiple shippers to fill trucks’ empty spaces, our shared truckload solution provides reliable and fast delivery, less damage, no accessorial fees, increased security, and overall better rates. To learn more about the inefficiencies plaguing the trucking industry, download the full report here.*The data supporting the content and objectives set forth in this press release come from an online survey conducted by Drive Research, a third party not affiliated with Flock Freight. The survey took an average of 21 minutes to complete and included 49 questions and received 200 responses. Fieldwork for the survey began on February 3 and ended February 23, 2023. Target industries included F&B, retail, building materials, industrial machinery and equipment, tech and electronics, plastics/paper/packaging, and automotive. A minimum of n20 was obtained from each industry. Target participant titles varied based on the size of the business (i.e., transportation buyers, load managers, transportation managers, VPs of supply chain, directors of transportation, logistics managers). A strong mix of company sizes to segment the data by the market included a distribution of $10M to $99M annual revenue, $100M to $499M annual revenue, and $500M or more annual revenue. With a probabilistic sample, a total of 200 responses at the 95% confidence level offers a 7% margin of error. If the survey were conducted with another random pool of 200 respondents, the results would yield within +7% or -7% of the stated totals in the reports. The margin of error can be used as a guideline to understand the reliability of these results.
.jpg)


